








The budget is unchanged, leads are down, and Search impression share has slipped. Someone wants to raise bids. Someone else thinks demand has dried up. You need to explain the gap before either suggestion becomes next month's plan.
I start by separating the size of the opportunity from what the campaign does with it. Think of a shop: a busier street does not guarantee more customers at the till. Eligible impressions describe potential exposure, clicks bring visitors to the site, and lead CVR measures the next step. In Google Ads, those opportunities can include repeated searches by the same person. I use the shop analogy to separate demand, delivery and conversion.
This walkthrough diagnoses fewer lead conversions, even when a campaign also tracks purchases. All performance figures below are synthetic.
My advanced checklist before I go into analysis mode
I use this checklist to identify the lead action and rule out a serving or measurement failure before analysing performance. Open the free printable checklist, or expand the checks below. The conversion-date comparison is explained in Section 1.
My setup checklist: reports, conversion timing and CRM evidence
| What I set up | Where I go and what I record | Why it matters |
|---|---|---|
| Conversion timing | Add Conversions and Conversions (by conv. time); inspect Segment → Conversions → Days to conversion. | Separate the performance of clicks bought in a period from leads arriving in that period. |
| The lead being diagnosed | Segment → Conversions → Conversion action. Record the lead action and retain the matching unsegmented click total. | A custom goal containing purchases and leads cannot supply a lead-only CVR directly. |
| Account changes or a sudden stop | Status and Change history: pauses, policy disapprovals, target/budget edits. Test the affected final URL and lead form. | Establish whether delivery stopped, the form failed, or completed leads are missing from reporting. |
When a CRM lead points to a measurement problem
A steady total of leads in your CRM system tells me little about Google Ads on its own; organic enquiries could be filling the gap. I first isolate completed lead forms with paid-search attribution, such as a captured GCLID linked to the lead record. MSCLKID identifies Microsoft Advertising clicks and belongs in that platform's reconciliation. Missing click IDs alone do not establish an organic source; other attribution evidence may be available. Google's click-ID measurement · Microsoft click IDs.
Suppose identifiable Google Ads leads continue reaching your CRM system while the corresponding Google Ads lead action drops to zero. Align the lead event, conversion dates, time zone, counting rules and attribution window, and allow for processing delay. A remaining discrepancy is a reason to investigate the measurement path:
- Website conversion: inspect the action under Goals → Conversions → Summary. With Google Tag Manager, use Preview/Tag Assistant to reproduce the successful form event and check the expected data layer event, trigger and Google Ads tag.
- Imported lead conversion: inspect upload diagnostics for rejected records, the conversion action, click ID and event timestamp. Confirm the event being imported is the same lead stage recorded in your CRM system.
A “No recent conversions” status alone does not prove tracking is broken. A captured click ID also does not guarantee conversion credit; attribution eligibility and counting still apply. Conversion diagnostics.
With reporting gaps and obvious serving failures accounted for, I start with the leads we actually received. The first question is how much of the shortfall fewer clicks can explain.
Lead shortfall · Demand and clicks · Coverage constraints · Price and competition · Commercial decision
1. Locate the lead shortfall
Define the outcome, then reconcile the numbers
A campaign can use a custom goal containing both a lead-form conversion action and a purchase conversion action. When both are included in its Conversions column, the campaign's reported conversion total is a mixture of outcomes.
Easy to miss: secondary conversion actions are still used for bidding when they belong to a custom goal selected for the campaign. If an action is intended for observation only, check its custom-goal membership before assuming the Secondary label excludes it. Google’s custom-goal exception.
For this lead diagnosis, I open Campaigns → Segment → Conversions → Conversion action, take the lead-form action's conversions, and divide by the campaign's clicks for the same dates and filters. Use the unsegmented click total; do not add it again for each conversion-action row. The campaign's bidding goals stay unchanged. Conversion-action reporting.
Lead CVR = selected lead conversions ÷ clicks.
Selected lead conversions = impressions × CTR × lead CVR.
Suppose the custom goal records 100 lead-form submissions and 50 purchases from 1,250 clicks. Conversions = 150 across those two actions. If eligible interactions are those clicks, Conv. rate = 12%. For lead reporting, however, 100 ÷ 1,250 = 8% lead CVR. Using the campaign's 12% would mislabel purchase conversions as leads. One person can generate more than one recorded conversion. Google's conversion columns.
Are leads down, or are recent clicks still converting?
Before changing bids or blaming the landing page, I compare Conversions with Conversions (by conv. time). I want to separate the results of traffic we bought from the flow of leads reaching the business. Those can move in different directions when people take time to convert.
In Campaigns → Columns → Modify columns → Conversions, add both columns and compare the same selected lead action:
- Conversions: assigns credit to the date of the attributed ad click. Use this view with that period’s clicks and cost to evaluate lead CVR and CPL.
- Conversions (by conv. time): assigns the conversion to the date the lead action happened. Use this view to investigate lead arrivals and reconcile them with paid-search lead records in your CRM system.
For example, someone clicks on 31 October and submits a lead form on 3 November. Assuming that one click receives all the credit, Conversions adds the lead to October; Conversions (by conv. time) adds it to November. October bought the visit; November received the enquiry. Google’s conversion-date definitions.
I compare each column’s movement between periods, then use the pattern to choose the investigation:
| What changed? | What I can conclude so far | What I check next |
|---|---|---|
| Click-date conversions fall; conversion-time leads stay steady or rise | Lead arrivals are holding up, but that does not establish that recent traffic is healthy. Older clicks may be supplying those leads, while recent clicks still have time to convert. | Inspect Days to conversion and revisit the same recent click-date range after the usual delay. If its CVR recovers as leads arrive, the initial decline was at least partly a timing effect. |
| Click-date conversions hold up; conversion-time leads fall | The business received fewer attributed leads during the period, despite steadier results credited to its clicks. Fewer leads from older clicks or conversions occurring outside the period can explain the difference. | Check conversion timing and earlier click volumes. Avoid cutting current bids solely because this period’s lead arrivals fell. |
| Both fall | The shortfall appears in both acquisition and lead-arrival reporting. Once conversion delay is allowed for, investigate fewer clicks, weaker lead CVR or a measurement gap. | Compare clicks and selected-action CVR; reconcile identifiable paid-search leads with your CRM system if the platform decline is not reflected there. |
For the delay check, open Segment → Conversions → Days to conversion on historical dates ending at least 30 days ago, or longer for a longer conversion window. Use the observed delay to decide when recent clicks have had a fair chance to convert. Google’s conversion-delay instructions.
My decision is whether to reassess after conversion lag, investigate a traffic/CVR decline, or trace a reporting discrepancy. Subtracting the two columns will not tell me how many leads are missing: they group conversions by different dates. For the 96-to-60-lead example, both click periods have already had comparable time to convert, so I can investigate the lead decline without that timing imbalance.
What the lead shortfall tells us
Here is a synthetic comparison with changes in delivery as well as conversion:
| Metric | Period A | Period B |
|---|---|---|
| Spend | $4,800 | $4,956 |
| Impressions | 24,000 | 24,600 |
| Clicks | 1,200 | 1,180 |
| Search IS | 40% | 30% |
| CTR | 5.00% | 4.80% |
| Average CPC | $4.00 | $4.20 |
| Lead CVR | 8.00% | 5.08% |
| Lead conversions | 96 | 60 |
| CPL | $50.00 | $82.60 |
Spend rose 3.3%, clicks fell 1.7%, and leads fell 37.5%. At the previous 8% lead CVR, 1,180 clicks would produce about 94 leads; we received 60. That puts the conversion decline ahead of traffic volume in my investigation, while the 5% CPC increase also contributes to higher CPL. I would split CVR by query intent and device before deciding whether the problem is the conversion path or a shift towards weaker traffic. Rates in the table are rounded; the calculations use counts.
Work backwards from the lead target
The main case points towards lower lead CVR. Before asking for more traffic, I work out how many clicks the lead target actually needs. This separate planning example uses a round target of 100 leads.
Required clicks = desired leads ÷ expected lead CVR.
For 100 leads at 8% CVR, you need 1,250 clicks. With a $5,000 spend allowance, supportable average CPC = $5,000 ÷ 1,250 = $4. Compare those requirements with actual delivery:

Synthetic example. Forward delivery and reverse planning, with spend held constant for the CPC comparison. Diagram: DEANLONG.io.
| Actual result against that plan | What it tells you | Next decision |
|---|---|---|
| Fewer than 1,250 clicks | Traffic is insufficient at the assumed CVR | Split spend utilisation, CPC, coverage and CTR. |
| At least 1,250 clicks, fewer than 100 leads | Actual lead CVR is below 8% | Locate the affected intent, device or conversion step after allowing for lag. |
| $5,000 spent, only 1,000 clicks | $5 CPC exceeds the $4 allowance | Investigate price and query mix in the affected slice. |
| $3,000 spent, only 1,000 clicks | $3 CPC is below allowance; delivery underspent | Investigate the restriction on spend before blaming click prices. |
More clicks only imply cheaper clicks at the same spend. Buying 1,500 clicks for $7,500 still costs $5 per click.
Fix the business target before rearranging the equation
That traffic plan only works if the clicks are affordable. I first agree what the business can afford per lead, then solve for the click price or conversion rate that fits. The target CPL below is that business allowance. It is distinct from actual CPL and from a Google Ads Target CPA setting, which may optimise towards several conversion actions.
| Decision | Fixed target or inputs | Solve for | Example |
|---|---|---|---|
| What average CPC fits our lead-cost target? | Target CPL; assumed lead CVR | Supportable CPC = target CPL × expected lead CVR | $50 × 8% = $4 |
| What lead CVR would make today's clicks affordable? | Target CPL; observed average CPC | Required lead CVR = observed CPC ÷ target CPL | $5 ÷ $50 = 10% |
| What CPL would these traffic assumptions produce? | Assumed CPC and lead CVR; no CPL target imposed | Expected CPL = CPC ÷ lead CVR | $4 ÷ 5% = $80 |
Observed inputs reconcile results; target inputs test a plan. CPC = CPL × CVR: multiply CPL by the conversion rate expressed as a decimal. This identity reconciles the numbers; the causes still need investigation. CPC depends on bidding, auction conditions and traffic mix; lead CVR also depends on intent, offer, device, measurement and the landing page.
Use 0.08 for 8% in equations, or 8 in the calculator. The supportable average CPC is a planning allowance; individual auction bids can differ. Zero leads leaves CPL undefined; zero clicks leaves click-based CPC and CVR undefined.
Put the formulas to work
Search performance calculator
Use this calculator to turn a lead shortfall into a decision: do you need more clicks, a better lead conversion rate, or a lower click cost? Choose a calculation, replace the example figures with your target and actual results, then use the explanation to select your next investigation.
For a cost decision, start with the business's target CPL. For a volume decision, choose Traffic plan vs actual. To investigate demand and coverage, compare eligible impressions or achievable clicks across periods. Enter 8 for 8%, use one currency, and count the same lead conversion action throughout.
The interactive calculator needs JavaScript. You can still use the formulas and worked examples above.
This calculator runs in your browser. It does not send or save the figures you enter.
Back to our 96-to-60-lead case: weaker CVR explains most of the shortfall, but it does not explain why Search IS fell from 40% to 30% while impressions increased. I would keep the conversion investigation moving and answer that coverage question before recommending a budget change.
2. Test demand against achievable clicks
Did the opportunity grow faster than your coverage?
I calculate the eligible impression pool to answer a management question: did we lose exposure, or are we keeping roughly the same exposure in a larger pool? A falling share needs that context before it justifies more budget.
Estimated eligible impressions = impressions ÷ Search impression share.
In the Campaigns or Ad groups table, open Columns → Modify columns → Competitive metrics → Search impr. share. Export it with Impressions for each comparison period. For this Google Search calculation, use the Google Search network row, excluding Search partners, so the impression count matches the share. Use the share Google reports for the whole selected period. Averaging daily percentages gives equal weight to days with different eligible volumes. Find impression-share columns.
Our example gives 24,000 ÷ 40% = 60,000 estimated eligible impressions, then 24,600 ÷ 30% = 82,000. Eligible opportunity grew 36.7%; delivered impressions grew only 2.5%. We captured a smaller share of a larger estimated pool.
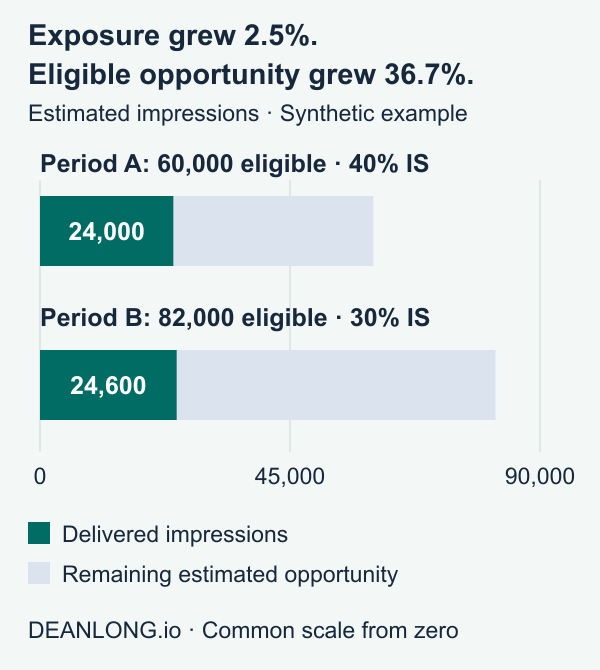
Synthetic comparison: exposure grew 2.5%; estimated eligible opportunity grew 36.7%. Common zero-based scale. Diagram: DEANLONG.io.
My reporting line would be: “Spend increased 3.3% and exposure held up, but our estimated eligible pool expanded much faster. We are validating whether that reflects category demand or broader campaign eligibility.” The next checks, including Google Trends, decide whether “market growth” belongs in that sentence.
Reconcile the lead change for the performance review
To connect opportunity with business output, I use a lead change factor: current-period leads divided by previous-period leads. Rearranging the lead formula lets me trace the volume change through the funnel. The result tells me how lead volume changed. I assess demand and cost efficiency separately.
Since impressions = estimated eligible impressions × Search IS, the lead formula becomes:
Leads = eligible impressions × Search IS × CTR × lead CVR.
Divide each term in Period B by its Period A value:
Lead change factor = eligible-pool ratio × IS ratio × CTR ratio × lead-CVR ratio.
For our example, using unrounded rates:
(82,000 ÷ 60,000) × (30% ÷ 40%) × [(1,180 ÷ 24,600) ÷ (1,200 ÷ 24,000)] × [(60 ÷ 1,180) ÷ (96 ÷ 1,200)] = 0.625.
That matches 60 ÷ 96: lead volume is 62.5% of the previous period, a 37.5% decline. Above 1 means growth; below 1 means decline. Here, the opportunity and share ratios produce 2.5% more impressions, but weaker CTR leaves 1.7% fewer clicks. The much larger CVR fall explains why the lead decline exceeds the traffic decline.
For the CFO, I would pair that volume result with CPL rising from $50 to $82.60: “We bought almost as many clicks, but converted substantially fewer into leads.” The factors show how the volume calculation fits together. Establishing what caused each change takes the checks below.
Validate a market-growth explanation
The lead calculation explains our output; it leaves the cause of the larger opportunity pool unresolved. I want evidence outside the campaign before calling that market growth. I use four comparisons:
- Keep the ad group and search intent comparable. Inspect the Search terms report and keyword match types. An existing exact-match keyword set can provide a tighter comparison, but exact match still includes searches with the same meaning or intent. Broad and phrase match can expand the query mix; check whether new themes explain the increase. Do not change live match types just to tidy the analysis, or substitute Search exact match IS into the total-impression formula. Keyword matching options.
- Compare Keyword Planner monthly history. Keep the same keyword list, location and network. Compare individual months and the same months last year; the default average monthly searches can hide seasonal movement. I look for a consistent pattern across the theme because overlapping terms and close variants can duplicate volume. Keyword Planner metrics.
- Check Google Trends over a continuous window. I start with 12 months to put a short-term rise in seasonal context, and use 24 months when comparing the same months year on year. A 100 in a 30-day chart marks that chart's peak. A separate 12-month chart has its own scale, so the two values can represent different search volumes. Keep the term/topic, geography, category and search type fixed, and compare points within the same export. Google Trends still normalises and samples the data within the chosen window. Google Trends methodology.
- Ask the Google representative for an Industry Benchmark Report. This is the report I use to discuss category demand beyond my account. My request is specific: “For our agreed business category and geography, can you show monthly search/query growth, click growth and investment growth over the last 12 months, with year-on-year comparisons?” I confirm whether investment means ad spend, how the category is defined and which markets the report covers. Search growth ahead of click growth would help explain why more interest is not producing proportionately more paid visits.
If category interest is flat but our pool expands, I would investigate query coverage before claiming market growth.
Is paid-click opportunity keeping up with search interest?
I have had to investigate this pattern: search interest rises, but click growth moves the other way. That is why I compare search, click and investment trends with my Google representative before treating market growth as a reason to spend more. Back at the shop, are more passers-by coming through the door? Click share lets me separate a change in achievable clicks from a change in our share of them.
Estimated achievable clicks = received clicks ÷ click share.
Add Click share under Competitive metrics and pair it with the received clicks for the same Search scope and dates. Google estimates achievable clicks using auction eligibility, including bids and quality. Its scope is the clicks our ads could achieve. Industry-wide paid-click volume needs separate evidence. Click-share definition.
Our main case does not include click-share data, so it cannot settle this question. The following separate synthetic scenario shows what I would look for when that report is available:
| Metric | Period A | Period B |
|---|---|---|
| Impressions / Search IS | 24,000 / 40% | 24,600 / 30% |
| Estimated eligible impressions | 60,000 | 82,000 |
| Clicks / click share | 1,200 / 40% | 800 / 32% |
| Estimated achievable clicks | 3,000 | 2,500 |
| Spend / average CPC | $4,800 / $4.00 | $4,920 / $6.15 |
Impression opportunity grew 36.7%, but achievable clicks fell 16.7% and our own clicks fell 33.3%. We faced a smaller estimated click pool and captured less of it. If the Industry Benchmark Report also shows searches growing faster than clicks, I would report that divergence and investigate query intent, device mix and search-result layout before proposing more spend.
A falling click share alone tells a different story: 900 clicks at 20% implies 4,500 achievable clicks, up from 3,000. In that case, our capture has fallen while estimated click opportunity has grown. Compare both periods before choosing a response.
Keep the two estimated pools separate: their eligibility bases can differ, so dividing achievable clicks by eligible impressions does not produce a market CTR. Weaker consumer confidence would need additional confidence, spending or qualified-lead evidence.
When share is masked, change the evidence
If both periods show “<10%”, their eligible-pool ranking remains unknown. With 24,000 impressions, a true 9% share implies roughly 267,000 eligible impressions; 5% implies 480,000. Both display identically.
Use a consistent, commercially meaningful slice with usable shares where available. Otherwise, leave exact pool growth unquantified and use the keyword/category evidence. The calculator shows the lower bound so the report keeps that uncertainty visible.
3. Identify the coverage constraint
Returning to the main case, estimated eligible impressions grew 36.7% while delivered impressions grew 2.5%. That makes coverage worth investigating, even though weaker CVR remains the larger lead-volume problem. I compare Search lost IS (budget) with Search lost IS (rank) to identify what may be limiting participation. Whether extra coverage is worth buying depends on the resulting qualified-lead cost.
Budget loss: where the strategy supports the metric, rising campaign-level Search lost IS (budget), budget utilisation and acceptable qualified-lead costs justify evaluating a limited budget test. I still need to estimate the cost and quality of the additional leads before increasing spend.
For Maximise conversions or Maximise conversion value without a target, use spend, outcomes and the budget simulator where available. These strategies seek to spend the budget; Google's guidance warns against diagnosing them through Lost IS (budget). Record target presence as well as the strategy name. Bidding guidance.
Rank loss: when Search lost IS (rank) rises, I compare two reports:
- Campaign: review Target CPA or Target ROAS and Change history. A lower Target CPA or higher Target ROAS asks bidding to meet a stricter efficiency target and can reduce participation. Compare the timing with the rank-loss increase.
- Search keywords: open Columns → Modify columns → Quality Score. Add Exp. CTR, Ad relevance and Landing page experience, plus their historical columns. Compare the affected keywords across periods; a worsening component identifies whether to inspect the ad's relevance, expected response or landing page. My guide to lowering CPC and improving ad quality walks through these checks.
I use Quality Score as a diagnostic dashboard: its component history helps me choose what to improve. Ad Rank depends on auction-time quality, bids, thresholds, context and other factors; the displayed 1–10 score is excluded from that calculation. A falling score therefore needs further investigation before I attribute lost impressions to it. Google's Quality Score guidance · Ad Rank factors.
Budget and rank constraints can coexist. I read both trends alongside delivered volume to decide which constraint deserves a test. Budget loss is campaign-level, and ad-group rank loss may be unavailable when budget ran out during the period. Reporting scope.
When an unattended target becomes part of the diagnosis
A target review also needs to account for platform changes. This matters when the account has an old target that no longer reflects the economics the business expects. Google completed its budget-constrained target-bidding update on 27 August 2026. Previously overachieving campaigns may move closer to their configured targets; Google does not automatically adjust those targets or budgets. Its stated benefit is more predictable scaling. Official FAQ.
Practitioner reactions are mixed. Kirk Williams' edited discussion questions his initial favourable reading. Ameet Khabra highlights the burden on smaller advertisers. Early r/PPC reports range from little change to worsening efficiency. I use those experiences to identify questions for the account review. Their mixed outcomes leave the performance effect account-dependent.
My concern is the maintenance burden. A campaign running at $60 CPA against an old $100 target can move towards that target and become worse for the business. Planning around the actual $60 while leaving $100 in the account creates that risk.
Compare configured target, mature actual CPA/ROAS and today's acceptable economics. Test a justified target adjustment against qualified volume and cost. Simply raising the budget does not guarantee the former efficiency will return.
Our worked case has no target-history evidence, so I would leave the cause of its coverage loss open. The next finding we can examine is concrete: average CPC increased from $4 to $4.20.
4. Explain click price and response together
A coverage restriction tells me where to investigate missed exposure. It does not, by itself, explain our case's 5% CPC increase. I locate that price change within comparable query themes and devices. More expensive traffic taking a larger share of clicks can lift the campaign average even when individual segments' prices hold steady. Search terms help expose that mix, although the report omits some low-volume queries. Search terms reporting.
I read placement alongside CTR to separate reduced coverage from a weaker response to the ads people actually saw:
- IS falls, top rates hold: coverage weakened relative to eligibility; served ads did not necessarily appear less prominently. Investigate pool growth and participation first.
- Top rates and CTR fall together: investigate prominence, query intent, ad/offer relevance and search-result layout in the affected slice.
- CPC rises, CVR holds: click-price pressure explains the CPL increase arithmetically. Investigate auction and mix evidence.
- CPC holds, CVR falls: locate the conversion or allocation change before bidding for more traffic.
Top and absolute-top rates describe placement when served; top impression shares describe captured eligible opportunity. Use Google's reported rates, whose counting rules differ from a reconstructed campaign-impression ratio.
Use Auction Insights to challenge the competition story
If the increase persists within comparable traffic, I use Auction Insights to test whether competition helps explain it. For the affected scope, compare overlap, position-above rate and your own CPC. Rising overlap plus a competitor appearing above you more often strengthens the competitive-pressure hypothesis, particularly when your targeting and bid settings stayed stable. Auction Insights definitions.
Overlap alone is weak evidence: 40 joint appearances out of your 100 impressions is 40%; the same 40 out of your 50 is 80%. Your reduced participation doubled the rate without extra joint appearances.
Check whether a target edit or query-mix change explains your withdrawal. Where competitor patterns and matched CPC movements persist after those checks, test relevance or bidding against qualified economics. Missing rows remain inconclusive because reporting thresholds apply; a competitor's spend and bid are not disclosed.
Keep CPM and CPC in the same calculation
I use effective CPM to check whether higher spend per thousand impressions came from dearer clicks or more people clicking. That distinction changes what I investigate next.
Effective CPM = CPC × CTR × 1,000.
At $2 CPC, CTR increasing from 3% to 6% raises effective CPM from $60 to $120. The click price never changed. Here, the higher CPM follows directly from the higher CTR. I would need separate auction evidence to make a competition claim.
Conversely, holding impressions, CPC and lead CVR constant, falling CTR reduces clicks, spend and leads while CPL stays flat. At 24,000 impressions, $4 CPC and 10% lead CVR, moving from 5% to 4% CTR cuts leads from 120 to 96 while CPL remains $40.
With spend held constant, fewer clicks produce a higher average CPC by definition. Unclicked impressions do not themselves incur an extra CPC charge. Expected CTR can affect auction quality, but a fall in observed CTR does not prove why click prices rose. Actual CPC factors.
5. Choose a test the business can afford
In our case, clicks became slightly dearer and converted into far fewer leads, pushing CPL from $50 to $82.60. Before choosing a conversion-path test or buying more coverage, I also want to know whether the leads still qualify at the same rate. A lower CPL would be a poor result if sales received more unsuitable enquiries.
Cost per qualified lead = CPL ÷ qualification rate.
A $50 lead at 50% qualification costs $100 per qualified lead. A $40 lead at 20% qualification costs $200. Use qualified outcomes from the same mature lead cohort, allowing for sales lag. Zero qualified leads leaves that cost undefined.
My guide to everything you need to know about value bidding connects those qualified outcomes to bidding strategy. If you change what conversion value represents, reassess the ROAS target against that new economic basis.
The example identifies a CVR decline, but does not yet establish its cause. Suppose the follow-up analysis isolates it to a mobile form, with comparable intent and stable qualification. I would test that form step, keeping bidding and targeting stable. Success means improved mature lead CVR and acceptable qualified-lead cost, measured within a predetermined spend cap and evaluation window. More unqualified submissions would not satisfy that test.
Bring the diagnosis back to one decision
Before I recommend more budget, I want to show what additional traffic could deliver at an acceptable qualified-lead cost. This is the summary I bring to that decision:
| Question | Evidence to put in the report | Decision it supports |
|---|---|---|
| Did the opportunity change? | Impressions ÷ Search IS; clicks ÷ click share; Google Trends and category benchmark | Distinguish growing demand from changing eligibility or weaker paid-click opportunity. |
| Are we capturing less? | Delivered impressions/clicks versus their estimated pools; compatible Lost IS (budget/rank) | Investigate budget, bid targets or ad quality before buying more coverage. |
| Are clicks becoming dearer? | CPC change within matched query/device groups; observed CPC versus target CPL × expected lead CVR; Auction Insights | Decide whether a price increase still fits lead economics. |
| Are clicks producing fewer leads? | Selected-action lead CVR; required versus actual clicks; conversion delay | Prioritise the affected intent, measurement or conversion-path problem. |
| Are those leads worth the cost? | CPL ÷ mature qualification rate; downstream value | Accept or reject the change on qualified outcomes. |
For this worked diagnosis, I would tell management: “Our estimated impression opportunity grew, but traffic barely changed. Lead CVR deteriorated, CPC rose slightly, and CPL reached $82.60 against the previous $50. My first test addresses the conversion decline; extra budget needs a separate case.” After a budget test, judge the additional qualified leads against the additional spend. After a conversion-path test, judge mature CVR and qualified CPL. The report should end with that business decision, the metric that will settle it and the point at which you will stop spending on an unsuccessful test.
Use this diagnosis with your AI assistant
I’ve turned this workflow into a reusable Paid Search Performance Diagnosis skill. Give it your campaign exports and business targets to work through falling leads, rising CPL and lead-quality problems, with evidence for each proposed next step. See the free skill and newsletter download offer.
I hope this helps you explain what changed and choose a test you can defend in your next performance review. If you’d like a second pair of eyes on your paid-search results, get in touch and tell me where performance has slipped.